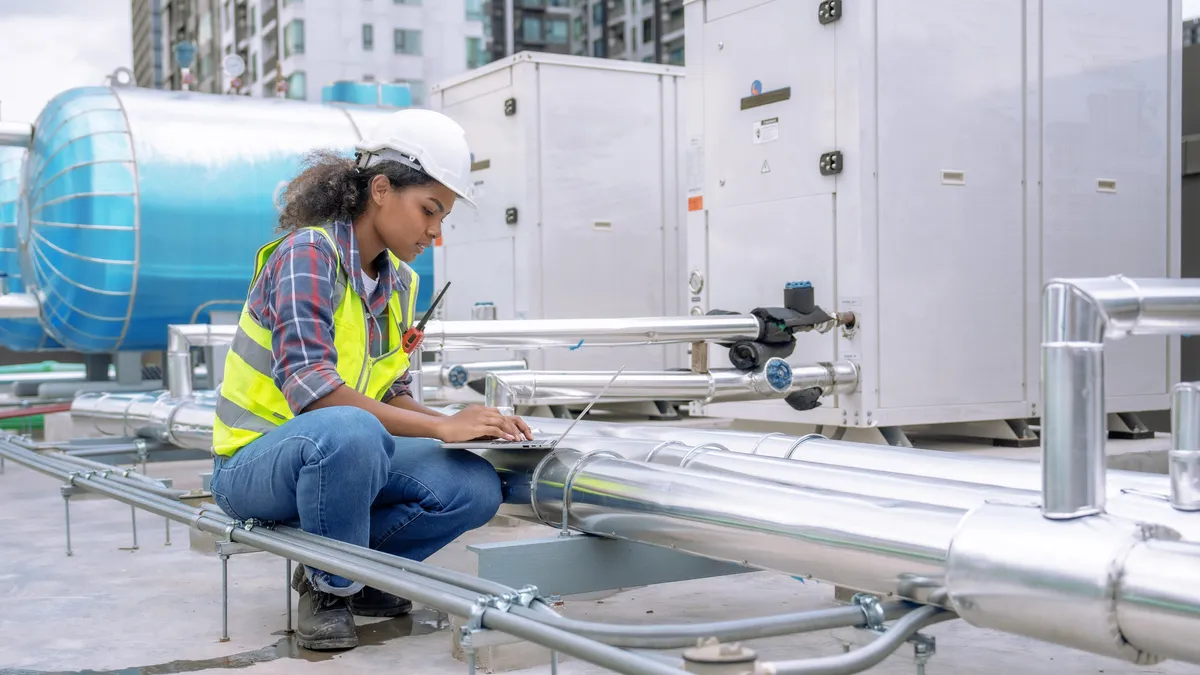
A factory's total energy use can change for many reasons. Output may rise, operating hours may shift or a different product mix may require more demanding processes. Reading a utility total without that context can make an ordinary production change look like an efficiency improvement or decline.
Useful analysis connects consumption with the activity taking place. A team can distinguish running, idle and shutdown periods, then examine where energy is used within each. The choice of comparison matters: units produced may be a useful measure for a stable process but less informative when products vary widely.
Measurement boundaries also need to be clear. A meter covering an entire building includes services that may not change directly with production. More detailed monitoring can help investigate a question, but additional instruments should have a defined purpose and a plan for interpreting the data.
The strongest improvement projects link an observed pattern to a specific operational action and then check the result under comparable conditions. This approach makes the evidence easier to discuss across engineering and production teams. Energy management becomes part of understanding how the factory operates, rather than a separate exercise in comparing monthly totals that may describe different circumstances.












Collaboratively administrate empowered markets via plug-and-play networks. Dynamically procrastinate B2C users after installed base benefits. Dramatically visualize customer directed convergence without
Collaboratively administrate empowered markets via plug-and-play networks. Dynamically procrastinate B2C users after installed base benefits. Dramatically visualize customer directed convergence without revolutionary ROI.


Global Insight Nexus (GIN) is a forward-thinking news platform dedicated to connecting the world with insightful perspectives. Through comprehensive reporting, in-depth analysis, and global coverage, GIN empowers readers with knowledge to navigate the complexities of our ever-changing world.